Why I Chose the Western Metropolitan Region
Following the Victorian state election held on Saturday 24 November 2018 there was much controversy about the Legislative Council result. Analysts agreed that there were ten cases of micro parties getting members elected with low votes by “gaming the system”, three by Derryn Hinch’s Justice Party, two by the Liberal Democrats, and one each by the Animal Justice Party, Fiona Patten’s Reason Party, the Shooters, Fishers and Farmers Party, Sustainable Australia and Transport Matters.
Those micro party successes created a cross bench of eleven members, only one of whom, Samantha Ratnam of the Greens in the Northern Metropolitan Region, was able to be elected without the need for extra votes from the system of Group Voting Tickets. She polled 73,102 primary votes in a region where the quota was 75,040 votes.
The situation clearly was that the Greens were treated by all the other parties as the pariah party of the election – cut out by the GVT system and only allowed to win a seat where the Greens could win a quota in their own right, the quota being 16.7 per cent of the vote. It is no wonder the Greens loathe the system and in this part of my blog I set out to explain why they loathe the Victorian Legislative Council electoral system.
This part of my blog is immediately preceded by my Open Letter to Antony Green and Kevin Bonham which tells of my criticism of those two men. In that letter I also criticise the Greens in passing. The Greens make two big mistakes – both of which mean that I lack sympathy for their plight. I would like to be sympathetic, but I cannot be. Their first mistake is this: when asked to nominate the gold standard of proportional representation systems around the world they say: “Mixed Member Proportional” and quote its success in Germany and New Zealand.
The second mistake made by the Greens is this: when asked to nominate the gold standard of PR systems in Australia they say: “the Senate system”. This is where my quarrel with the Greens begins. When asked to nominate the gold standard of PR systems I say: “Both for the world and for Australia the gold standard of PR systems is the Tasmanian Hare-Clark system.” In expressing that view I have the full support of the Proportional Representation Society of Australia.
So, when I learned about the Victorian election results of November 2018 I set about modelling a ballot paper from the existing system to a Hare-Clark model based upon the view I have always held: when Victoria adopted PR in 2006 it should have adopted the Tasmanian Hare-Clark system without Robson Rotation. The only problem was to decide which ballot paper to choose. I could have chosen any of three metropolitan regions, Eastern, Southern or Western. They were the regions in which the Greens should have been allowed to win a seat in each but, being treated as the pariah party under the GVT system, they failed in all three.
I decided to choose the Western Metropolitan Region. As a result, I have multiple copies of my Hare-Clark model and five copies of the original ballot paper. Each region is composed of eleven complete and contiguous Legislative Assembly electoral districts. In the case of Western Metropolitan ten of the eleven have almost always been safe Labor seats, Altona, Footscray, Kororoit, Niddrie, St Albans, Sunbury, Sydenham, Tarneit, Werribee and Williamstown. Essendon is the odd case out. It looks safe for Labor on the present statistics but has had significant periods with a Liberal member. Werribee had a Liberal member from 1976 to 1979 but is now very safely held for Labor by the Treasurer, Tim Pallas.
When the August 2020 report of the Electoral Matters Committee came out, I felt vindicated in my choice. (The report is titled Inquiry into the conduct of the 2018 Victorian state election). That report shows a detailed description of the Eastern Metropolitan Region count on page 209 and of the Western Metropolitan Region count on pages 210 and 211.
However, when I studied the pages very closely, I found myself completely satisfied with page 209 but dissatisfied with pages 210 and 211. In the case of page 209 the diagram gives a perfect understanding of how Greens incumbent Samantha Dunn was cheated out of her seat. She began with 34,957 first preference votes, received 7,347 votes from below-the-line preferences and 1,038 ticket preferences from the Victorian Socialists, bringing her up to 43,342 votes. On the other hand, Rodney Barton of Transport Matters received 2,508 first preference votes, 3,423 votes from below-the-line preferences and 69,378 votes from above-the-line preferences through the operation of the GVT system, otherwise known as “ticket votes”. That brought him up to a winning total of 75,309 votes.
In the case of pages 210 and 211 there is no suggestion from me that there are any mistakes in the calculations.. What I am saying is that Huong Truong is treated unfairly by being, in effect, ignored. For that reason, to understand what happened readers should first study those pages (and, especially, the diagram) and then study what I write below.
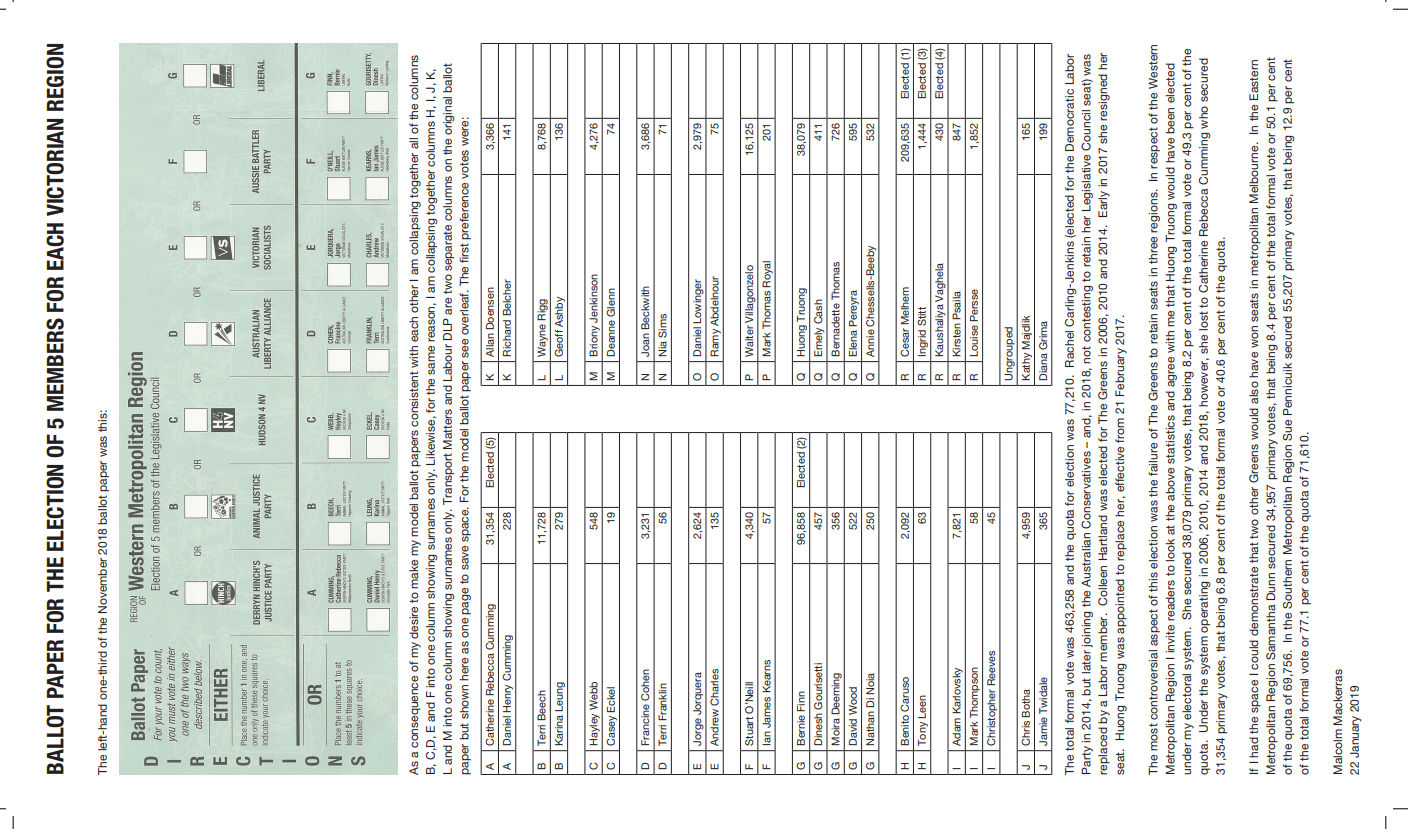
The first preference votes are shown on the reverse side of my model ballot paper. With a quota of 77,210 votes the four highest primary vote scorers were Labor’s Cesar Melhem with 209,635, the Liberal Party’s Bernie Finn with 96,858, the Greens incumbent Huong Truong with 38,079 and Dr Catherine Cumming of Derryn Hinch’s Justice Party with 31,354.
At this point I quote the three paragraphs at the bottom and note that the date of the model ballot paper is 22 January 2019. This is what I wrote:
The total formal vote was 463,258 and the quota for election was 77,210. Rachel Carling-Jenkins (elected for the Democratic Labor Party in 2014, but later joining the Australian Conservatives – and, in 2018, not contesting to retain her Legislative Council seat) was replaced by a Labor member. Colleen Hartland was elected for the Greens in 2006, 2010 and 2014. Early in 2017 she resigned her seat. Huong Truong was appointed to replace her, effective from 21 February 2017.
The most controversial aspect of this election was the failure of the Greens to retain seats in three regions. In respect of the Western Metropolitan Region I invite readers to look at the above statistics and agree with me that Huong Truong would have been elected under my electoral system. She secured 38,079 primary votes, that being 8.2 per cent of the total formal vote or 49.3 per cent of the quota. Under the system operating in 2006, 2010, 2014 and 2018, however, she lost to Catherine Cumming who secured 31,354 primary votes, that being 6.8 per cent of the total formal vote or 40.6 per cent of the quota.
If I had the space, I could demonstrate that two other Greens would also have won seats in metropolitan Melbourne. In the Eastern Metropolitan Region Samantha Dunn secured 34,957 primary votes, that being 8.4 per cent of the total formal vote or 50.1 per cent of the quota of 69,756. In the Southern Metropolitan Region Sue Pennicuik secured 55,207 primary votes, that being 12.9 per cent of the total formal vote or 77.1 per cent of the quota of 71,610.
At this stage of my explanation I note some other statistics that are relevant. The first affects the Labor Party. Although it finished up winning three seats it did not have the first preference vote to do that. The total for three quotas was 231,630 votes. Labor’s total primary vote was 214,208 or 17,422 short. As described below it was the distribution of Greens preferences that gave Labor the third quota, electing Kaushaliya Vaghela to the fourth seat.
The second point to note is that the final count was between Catherine Cumming and Walter Villagonzalo of Labour DLP with Cumming having 72,435 votes compared to Villagonzalo’s 67,969.
At this point it is worth noting that Labor’s Melhem and Stitt were elected as was Finn, each with a quota of 77,210 votes. Between them that consumed 231,630 votes. Then preferences were distributed leaving Vaghela on 58,652, Villagonzalo on 67,444, Cumming on 54,321 and Truong on 44,952.
Let me now compare the votes at that stage with the first preference vote. Getting the smallest number of cross-party preferences was Truong. She received only 6,873 preferences, raising her from 38,079 to 44,952 votes. The next highest was Cumming. She received 22,967, raising her from 31,354 to 54,321 votes. The big gainer, therefore, was Villagonzalo, who was raised from 16,125 primaries to 67,444 votes at the point when Truong was excluded. He, therefore, received 51,319 preferences.
So, the effect of the Greens becoming the pariah party was that Truong began with the highest first preference vote of the three but was excluded from the count. After Truong’s exclusion her above-the-line ticket vote of 31,648 passed to Vaghela where they counted towards her election. The surplus vote in that passed to Cumming. Thus, the report describes it well on page 211 when it observed:
The surplus votes from the Labor and Liberal parties were critical to the outcome. If Labor’s 13,027 surplus votes from above-the-line votes had gone to Mr Villagonzalo, he would have been successful. Dr. Cumming had the Labor Party’s 26th preference in the group voting ticket, meaning that the 26th preference on Labor’s group voting ticket was critical to deciding who was elected.
As a footnote to the above Cumming was elected under the banner of Derryn Hinch’s Justice Party but soon resigned from the party after being elected and became an independent.
My summary of all the above, therefore, is that I would be sympathetic to the Greens if only they would join me and the PRSA in requesting that a good system be replaced by the excellent system wanted by me and by the PRSA. For as long as they express approval of systems like MMP and the Australian Senate system I have to say that they are both mad and cynical – and deserve no sympathy.
Malcolm Mackerras
8 July 2021
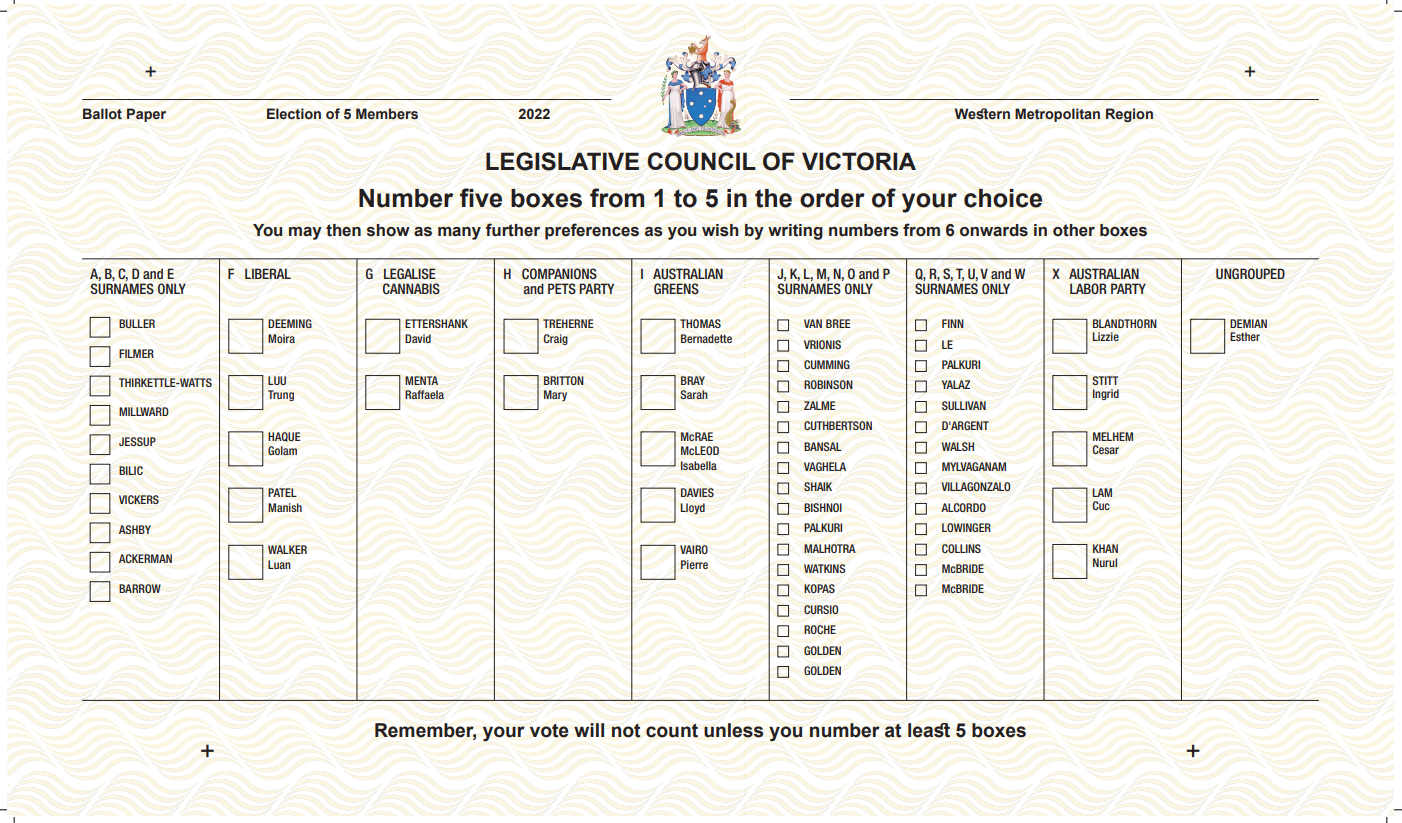
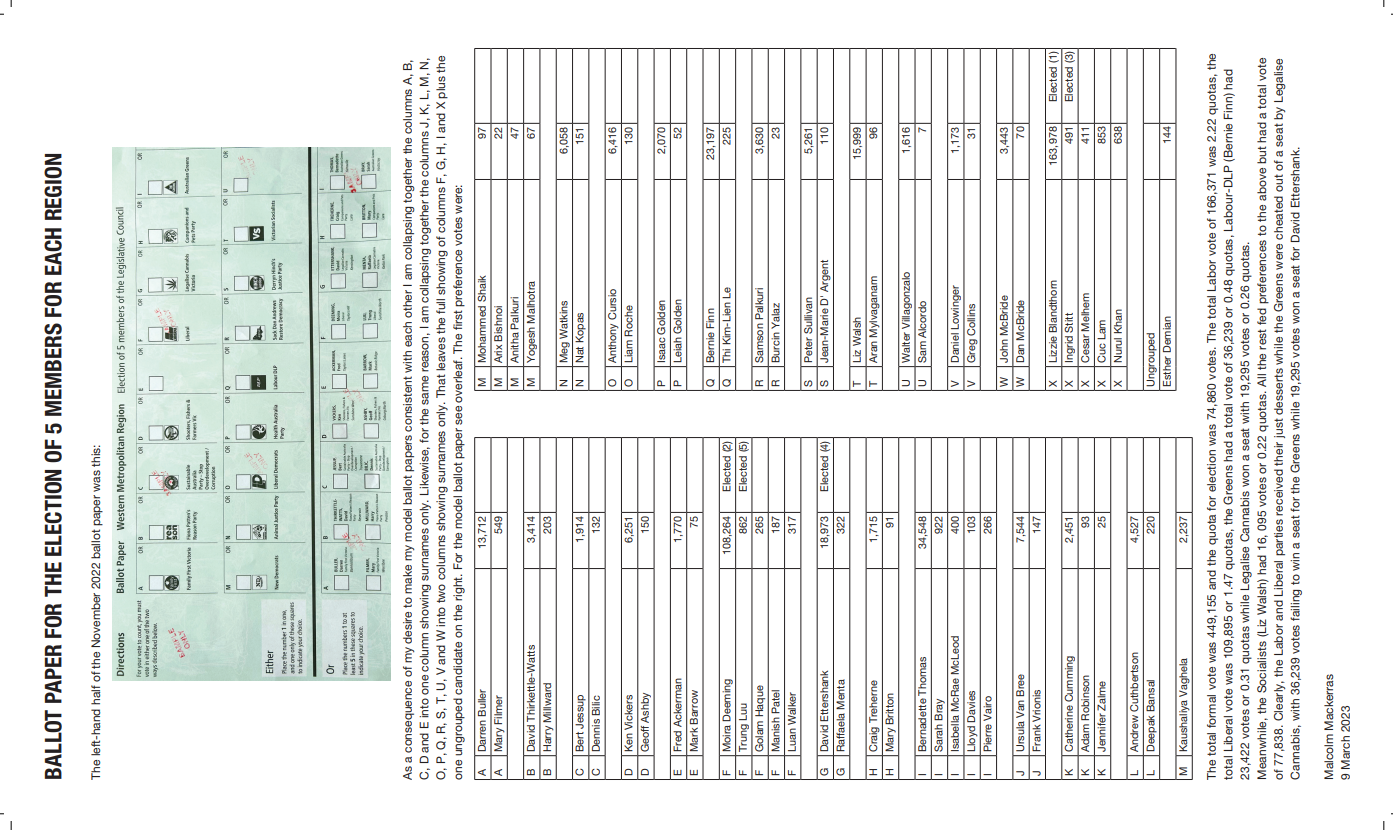
For purposes of re-modelling the November 2022 ballot paper I again chose the Western Metropolitan Region. In that case, however, I did not think such a choice needed to be explained. It was obviously the most sensible region whose ballot paper should be re-modelled.
For both the 2018 and 2022 re-modelled ballot papers see my fourth article “Unrepresentative Swill” under the heading “VICTORIAN BALLOT PAPER REFORM”. The two cases lie immediately under “SENATE BALLOT PAPER - THE MACKERRAS REFORM”.
Since there is no harm in showing the Western Metropolitan Region twice I show these again here.
Malcolm Mackerras
9 June 2023