Mackerras Pendulums
What is the ‘Mackerras Pendulum’?
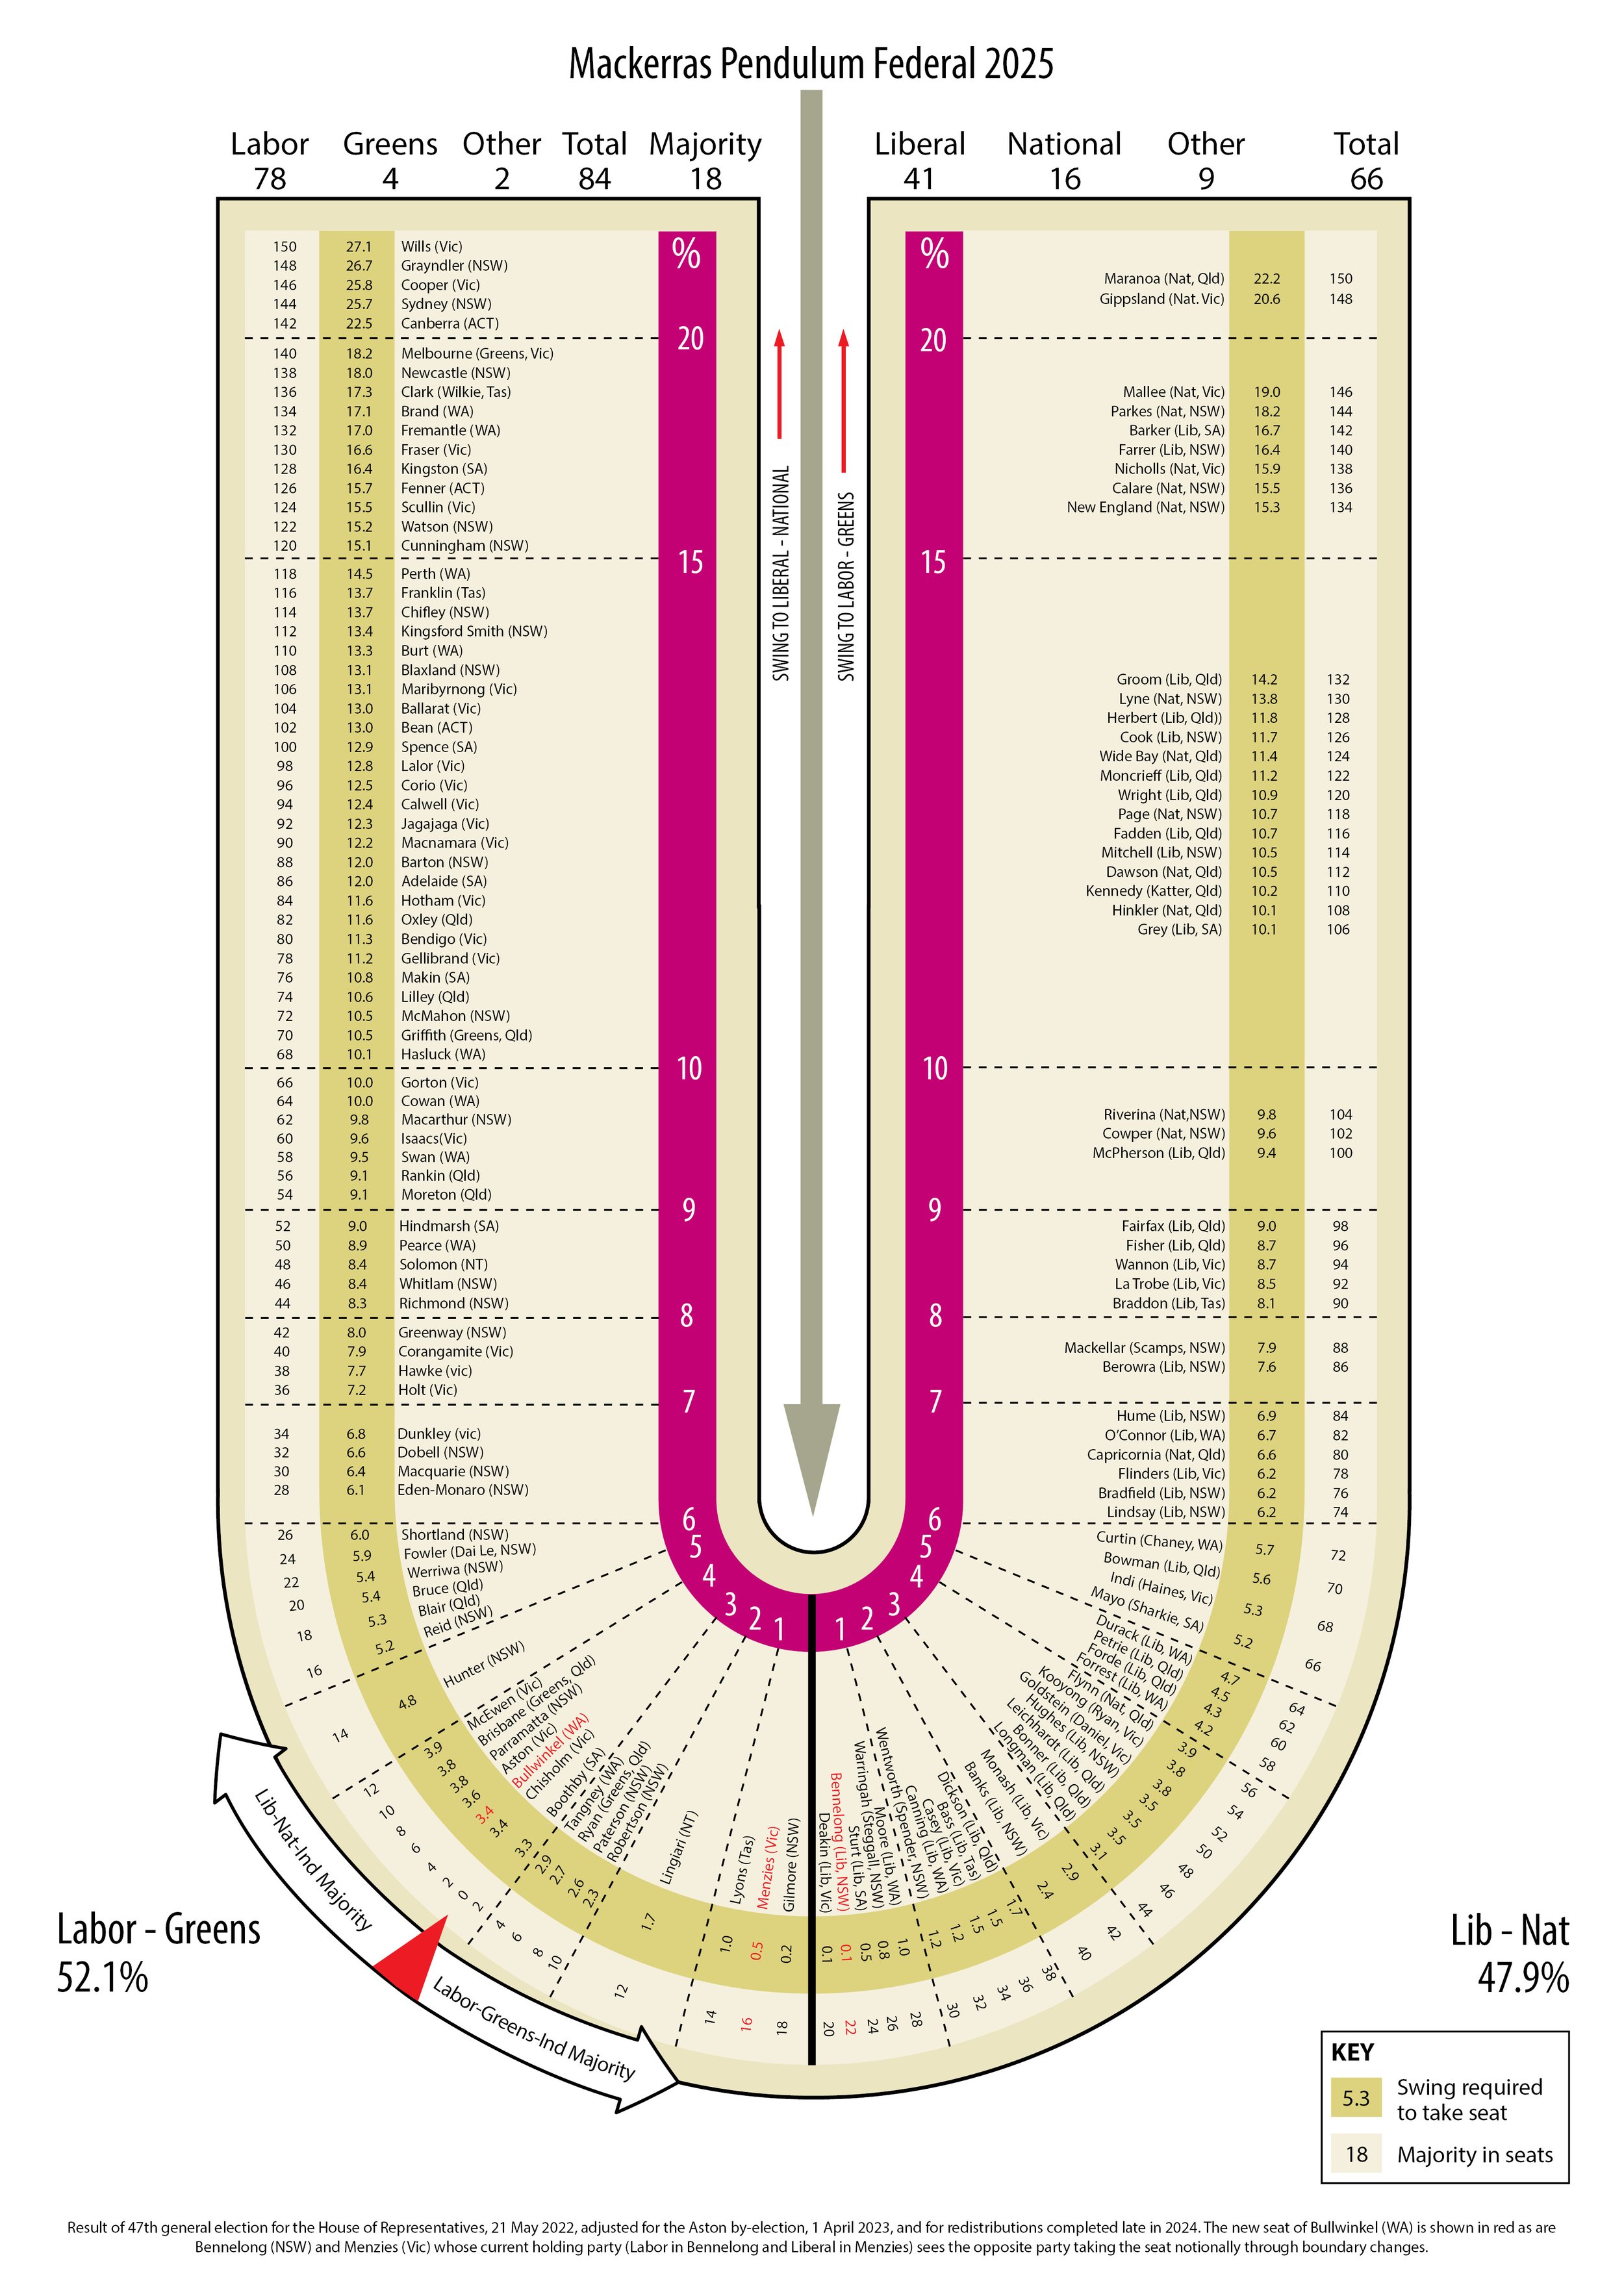
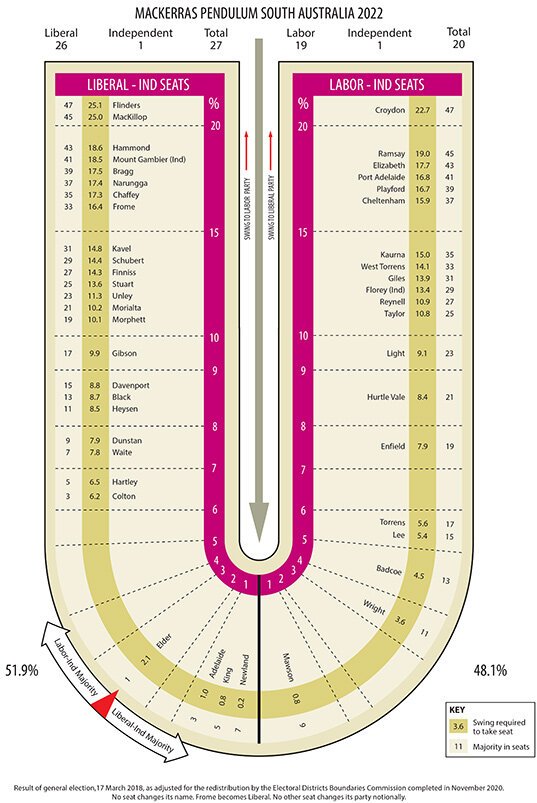
The Mackerras Pendulum ranks all the seats in two-party preferred terms from highest to lowest Labor percentage. Marginal seats, therefore, lie in the middle, at the bottom of a horse-shoe type of diagram. The party holding the seat is always shown. Next to it is shown the percentage swing required for that party to lose the seat.
For some fifty years, my pendulums have been published in newspapers and magazines. I would call it “electoral pendulum” but then, in the early seventies, came along the eminent British psephologist the late Sir David Butler (1924-2022). He started to call it “Mackerras Pendulum”. I thought this to myself: “If David Butler thinks it should be called that why should I not also call it the eponymous ‘Mackerras Pendulum’?”
Regarding the order of presentation of my pendulums, my idea is that they go in the order of importance of the jurisdiction. However, there is one exception to that rule. Since South Australia is the jurisdiction most recently to have conducted a general election, its place is distinguished by being placed last. That election was unusually interesting. It was held on 21 March 2026.
Subsequent to my last big revision on 29th January 2024 I have posted new post-election pendulums for New South Wales for the March 2023 elections and for Victoria in respect of their November 2022 elections.
The next general election coming up will be for Victoria on Saturday, 28th November 2026. See the ninth pendulum here described on the bottom as “Result of General Election, 26 November 2022 adjusted for the Prahran by election 8 February 2025”.
I expect my new pendulum to be published in the Melbourne “Herald Sun” about four weeks before polling day.
Malcolm Mackerras
24 July 2026
Click on the pendulum to download a PDF file.
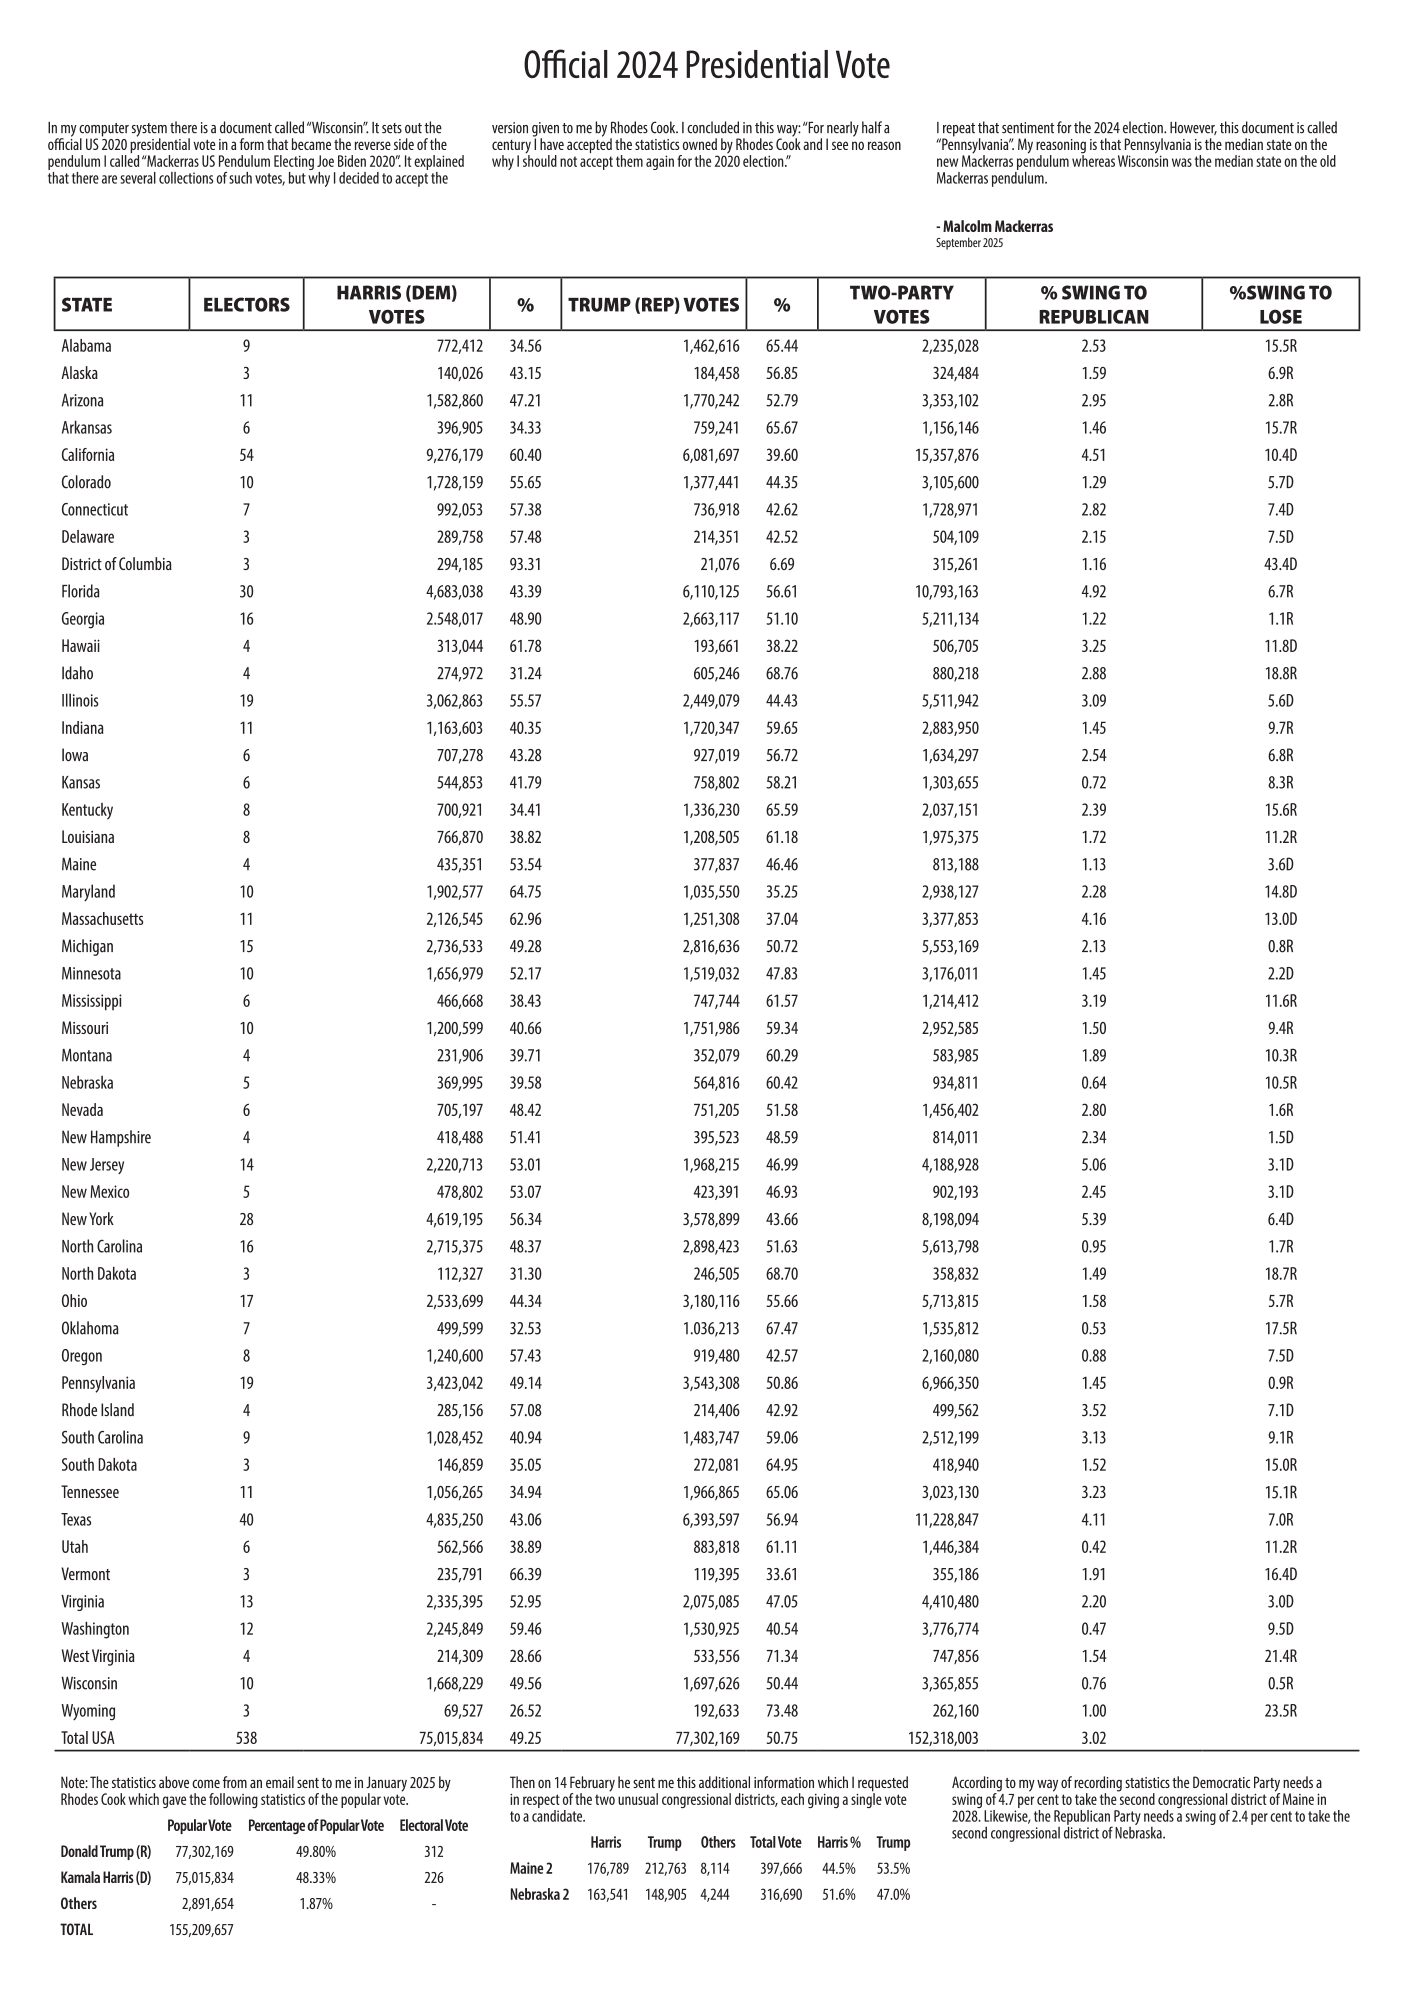
US Presidential Election: 2024

US Presidential Election: 2020

US Presidential Election: 2016

Mackerras Pendulum Federal 2025 Result


Mackerras Pendulum Federal 2022 Result, Adjusted for new boundaries in 2025


New South Wales: 2023


Victoria: 2026


Victoria: 2022 Result

Queensland: 2024

Queensland: 2020

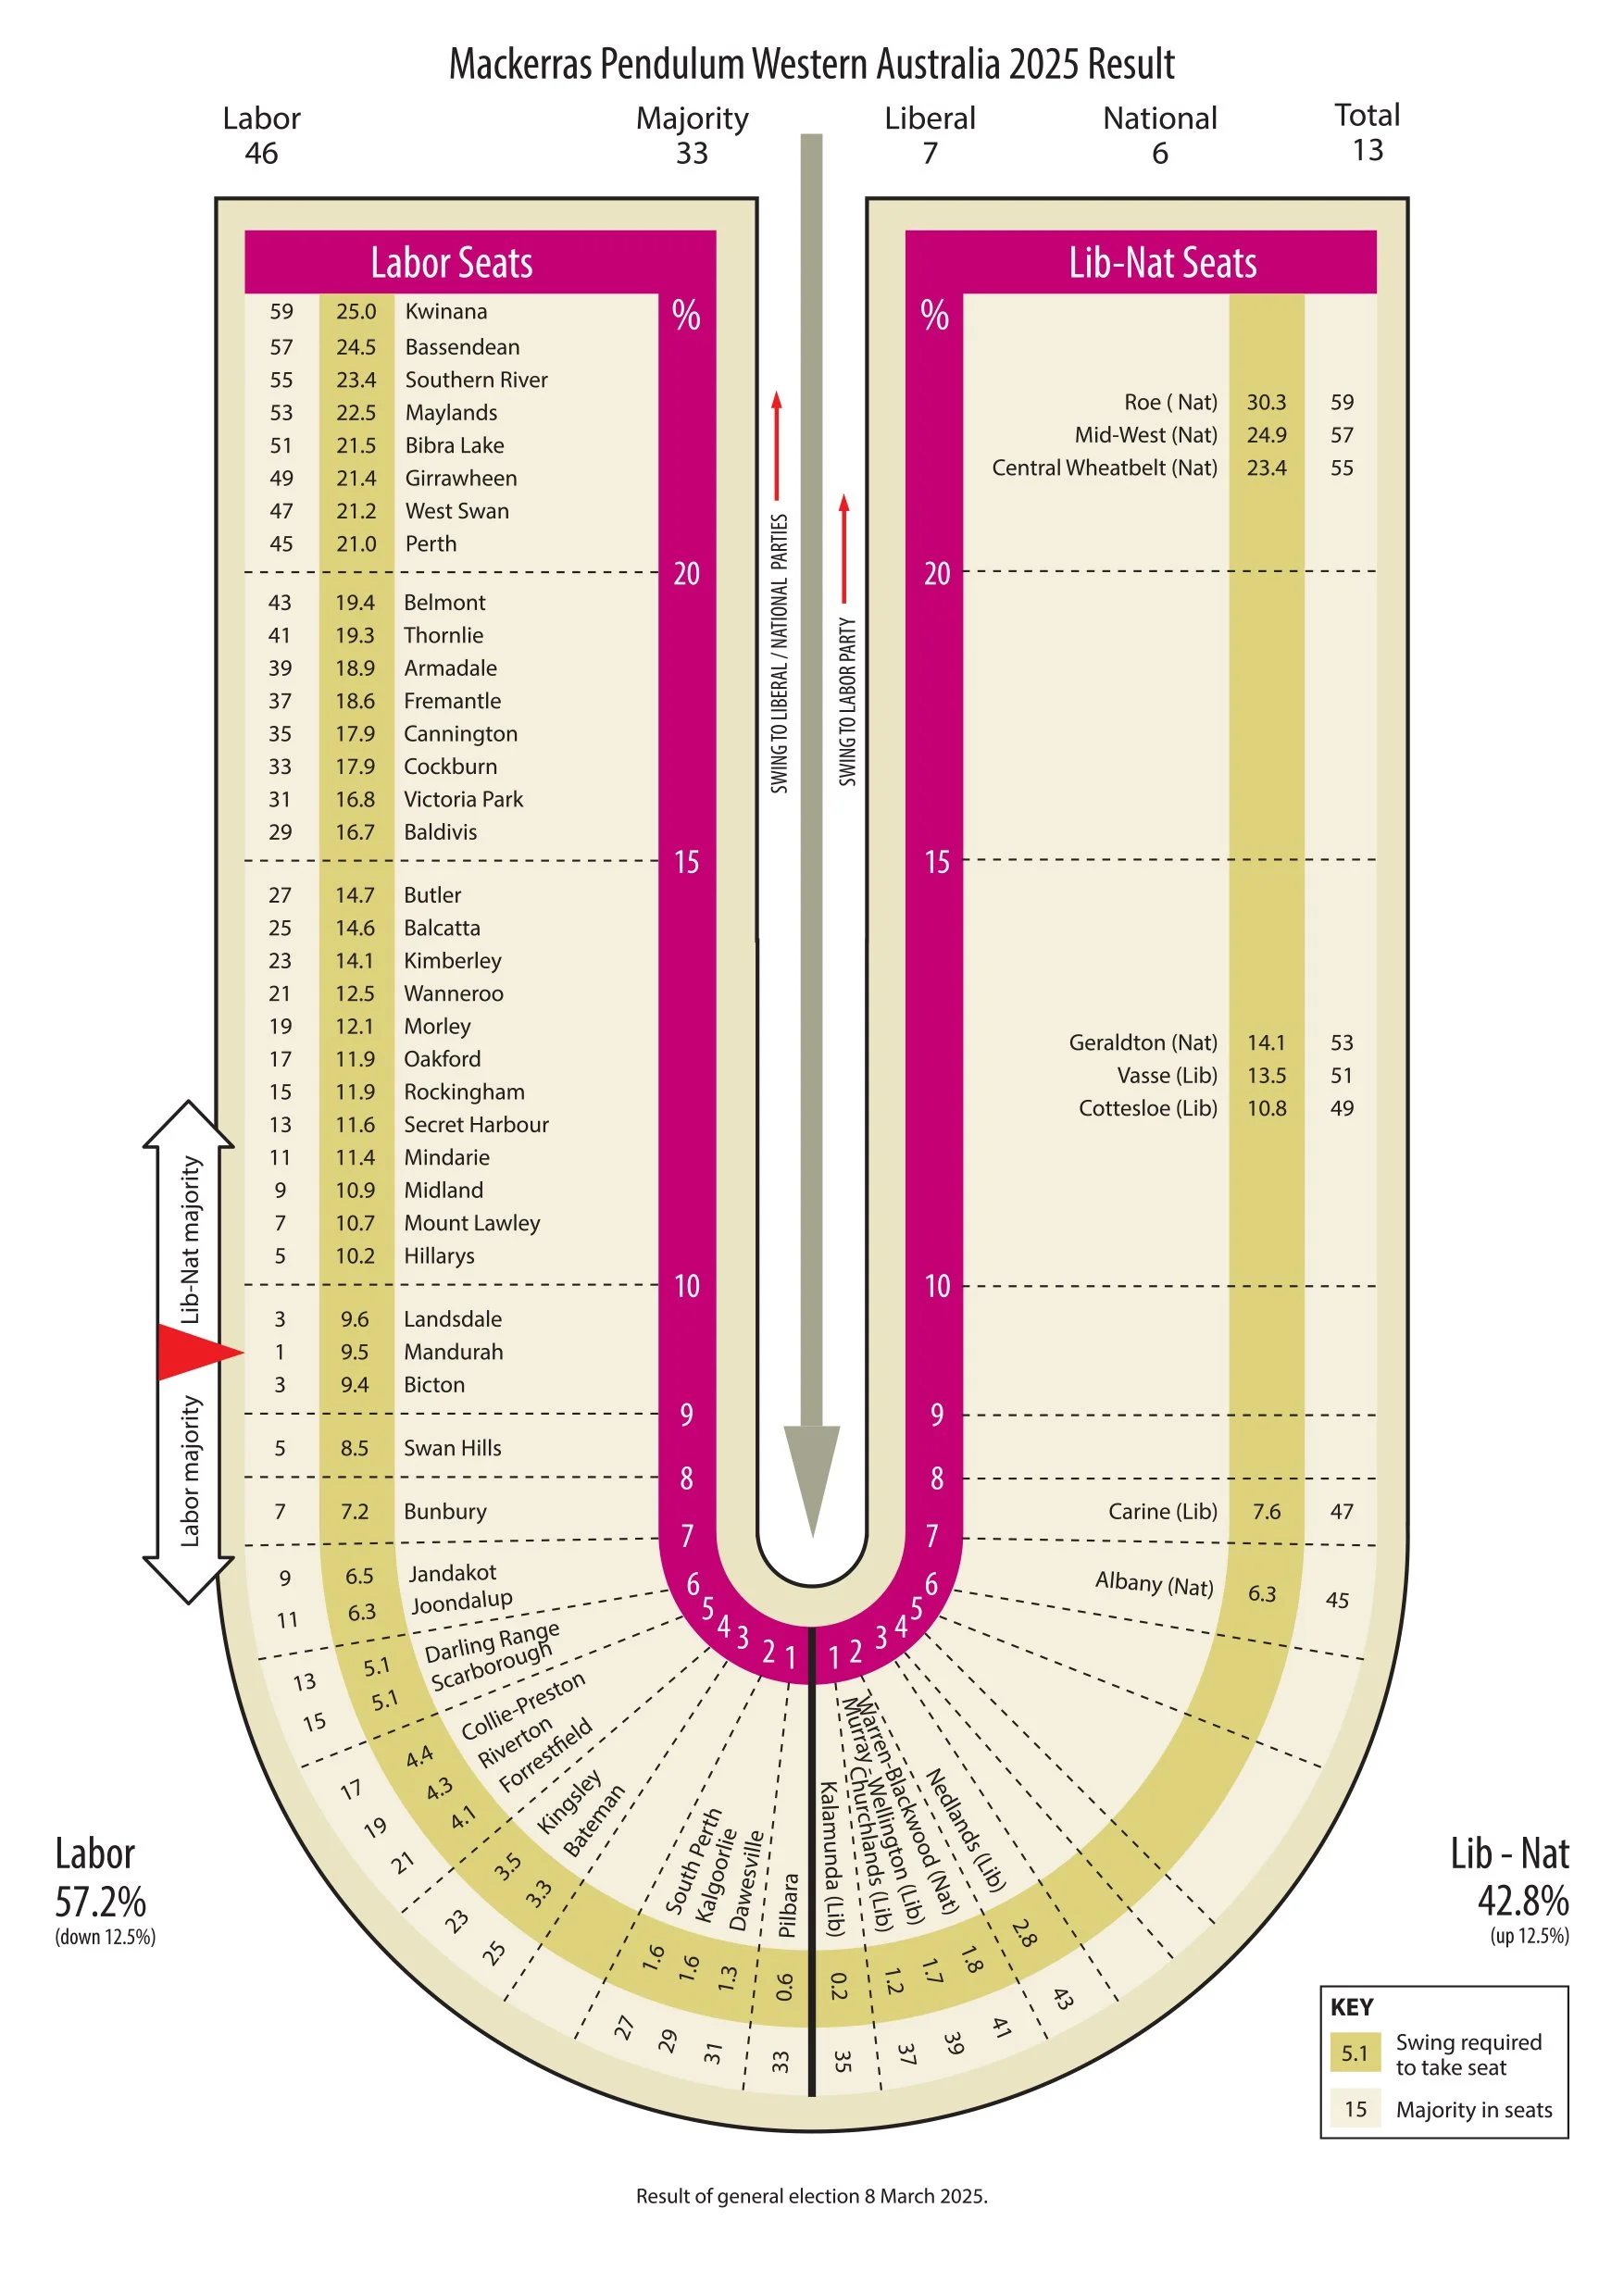
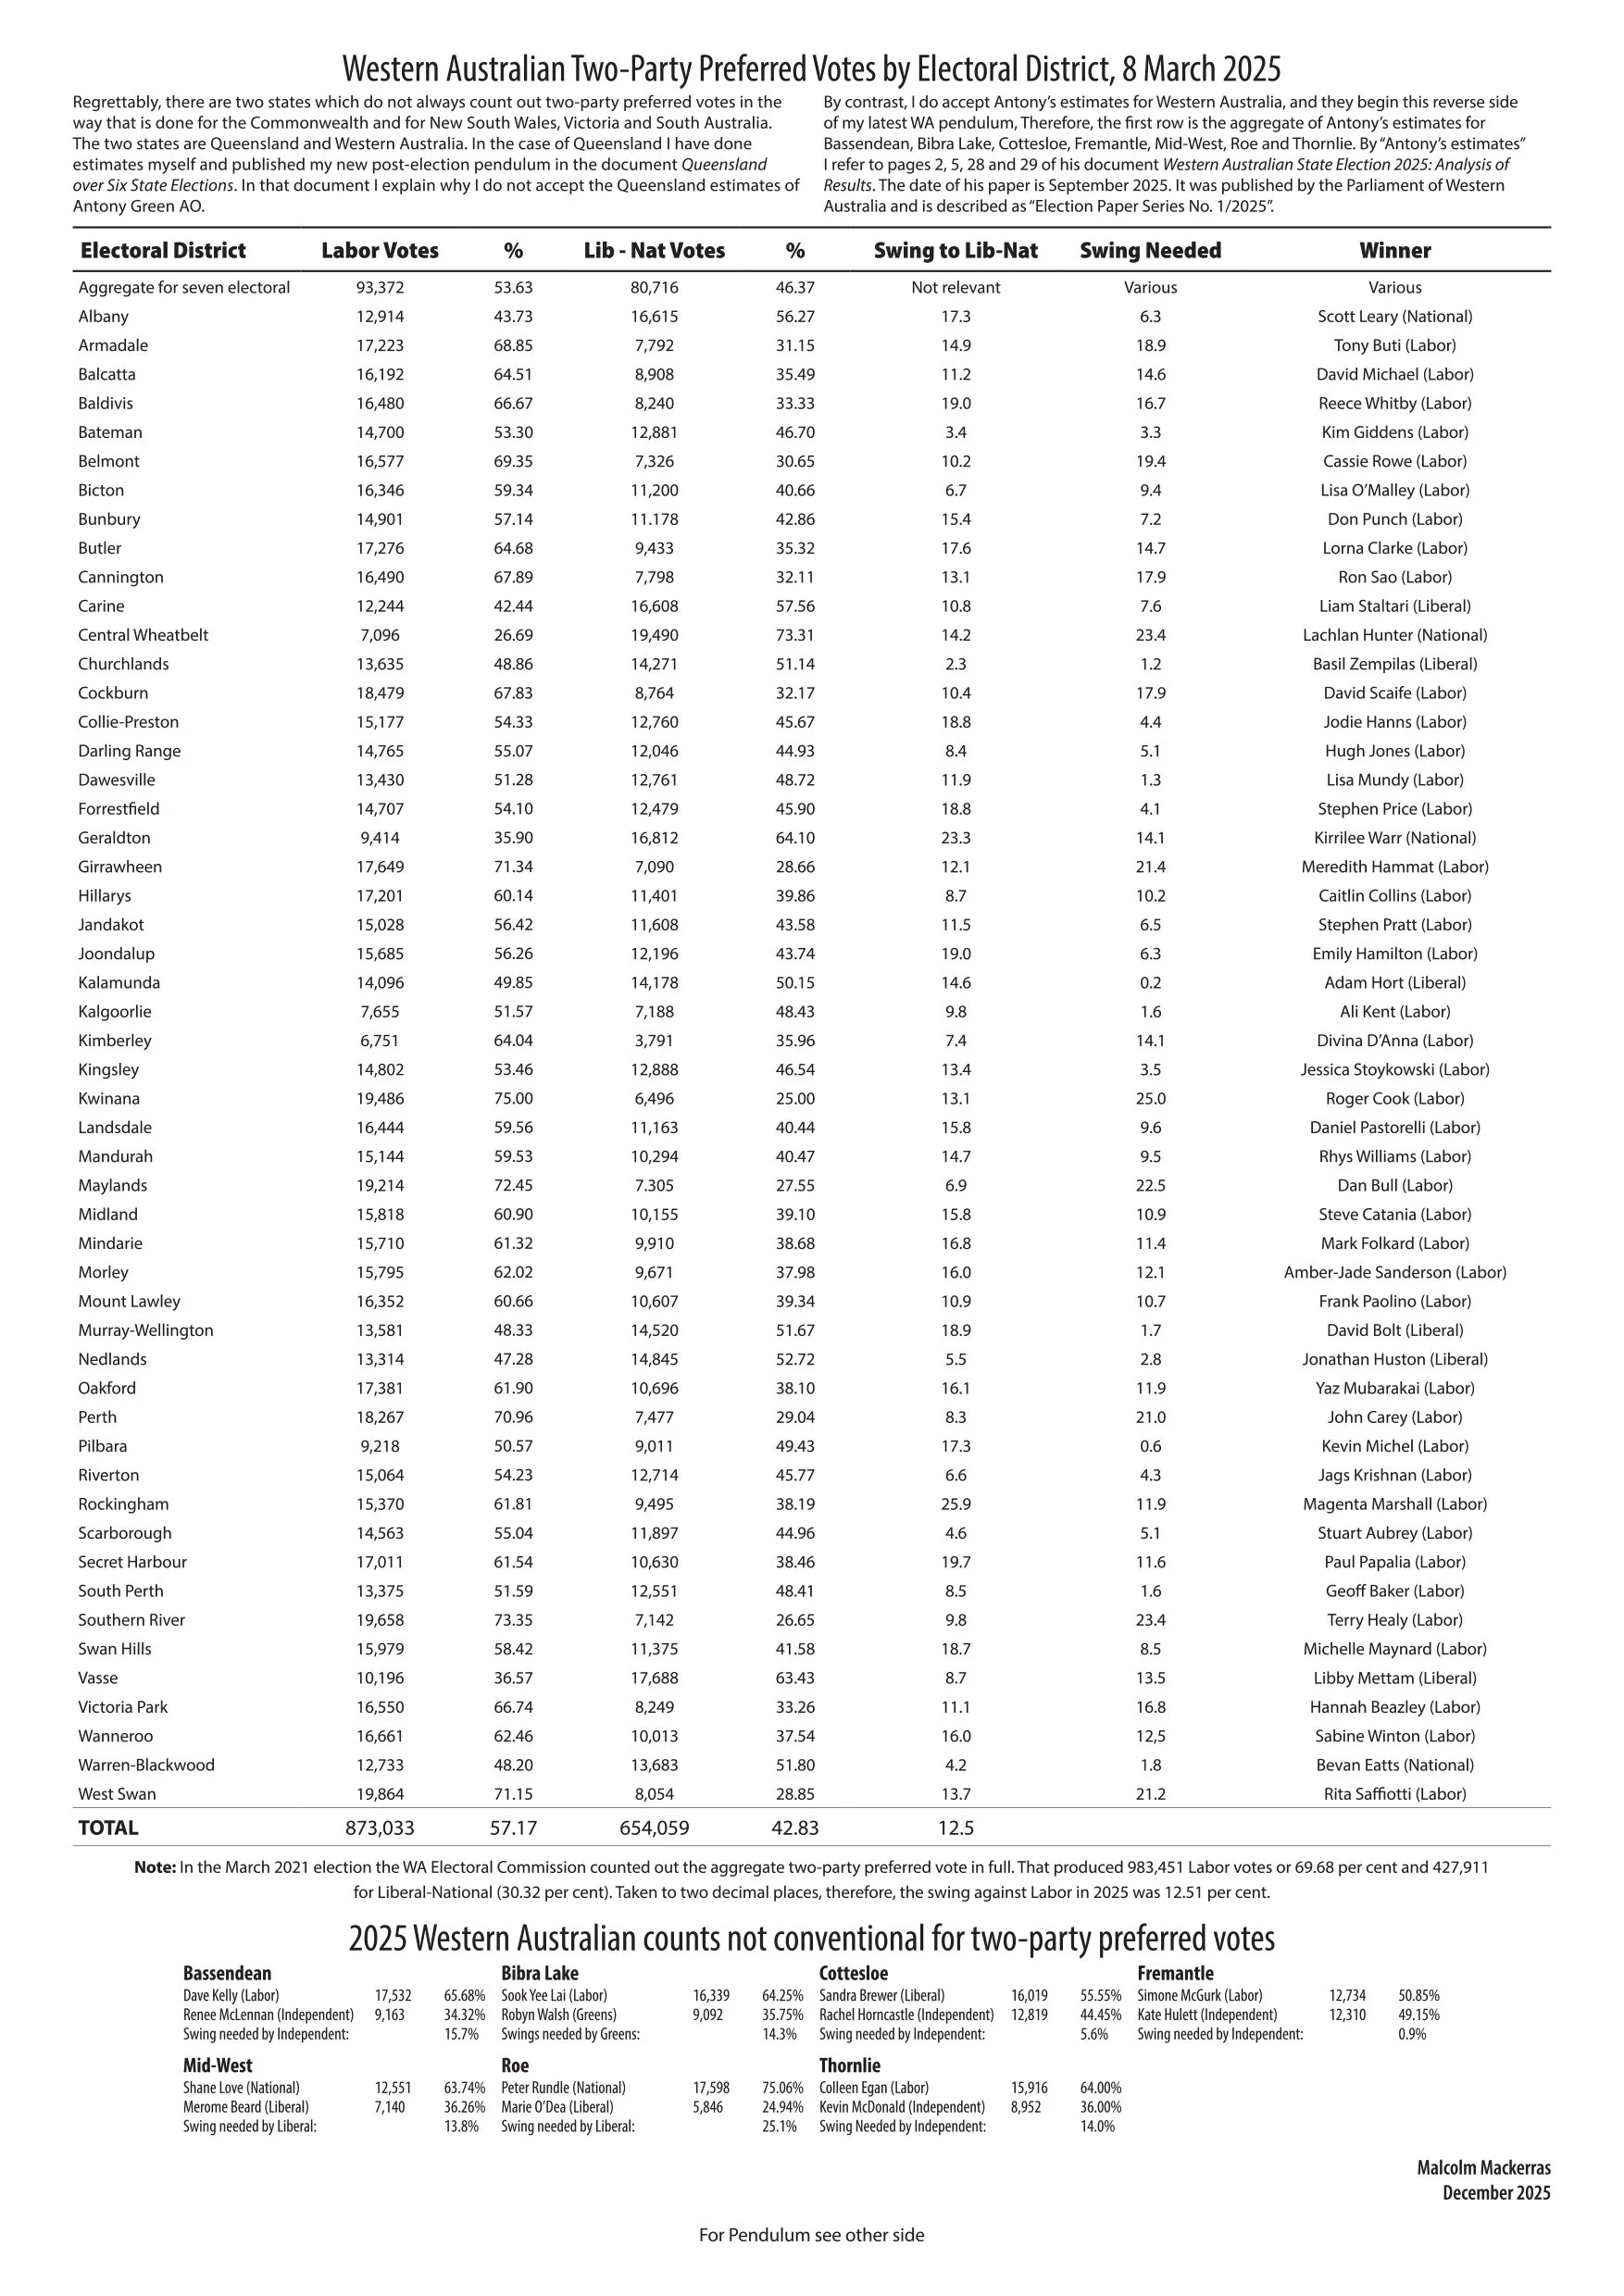

Result of general election 13 March 2021, as adjusted for the 2023 redistribution of electoral boundaries. The new seat is Oakford in Perth’s southern suburbs. It is shown in red. Five other seats are also shown in red, being the new names Bibra Lake for the old Willagee, Girrawheen for the old Mirrabooka, Mid-West for Moore, Mindarie for Burns Beach and Secret Harbour for Warnbro. The old seat of North West Central has been abolished. For more information see overleaf.
Western Australia: 2021

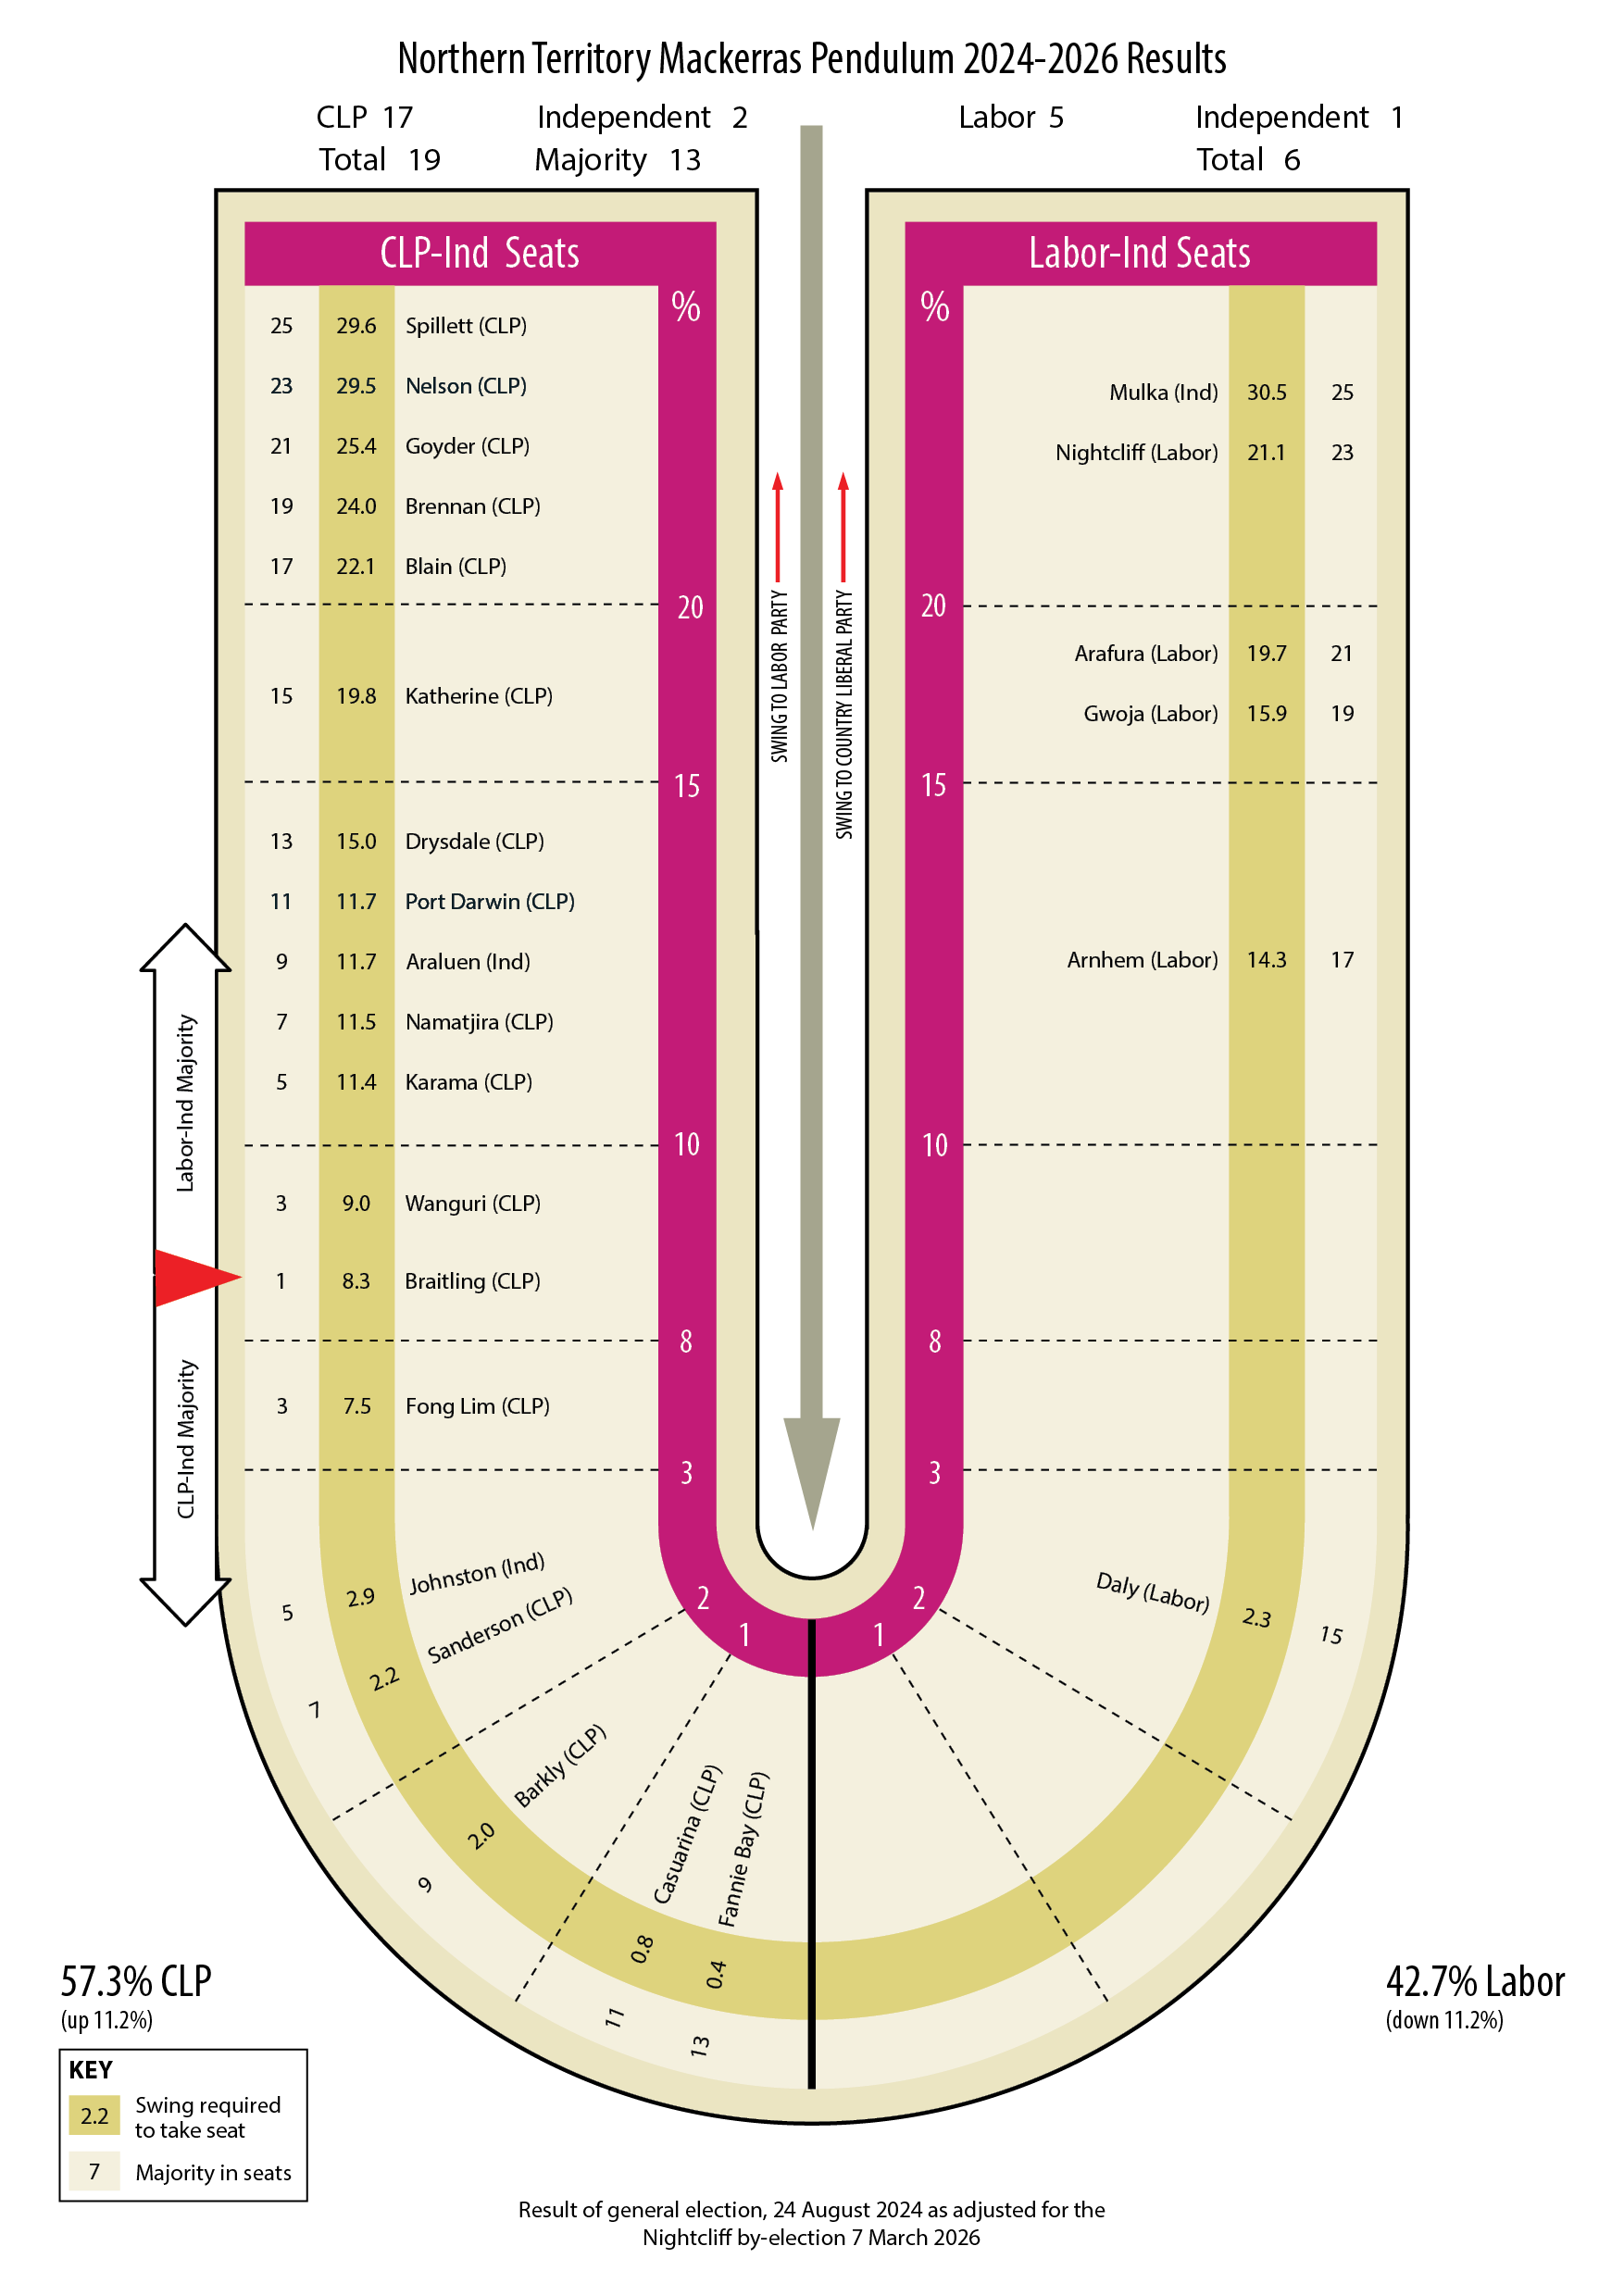
Northern Territory: 2024-2026
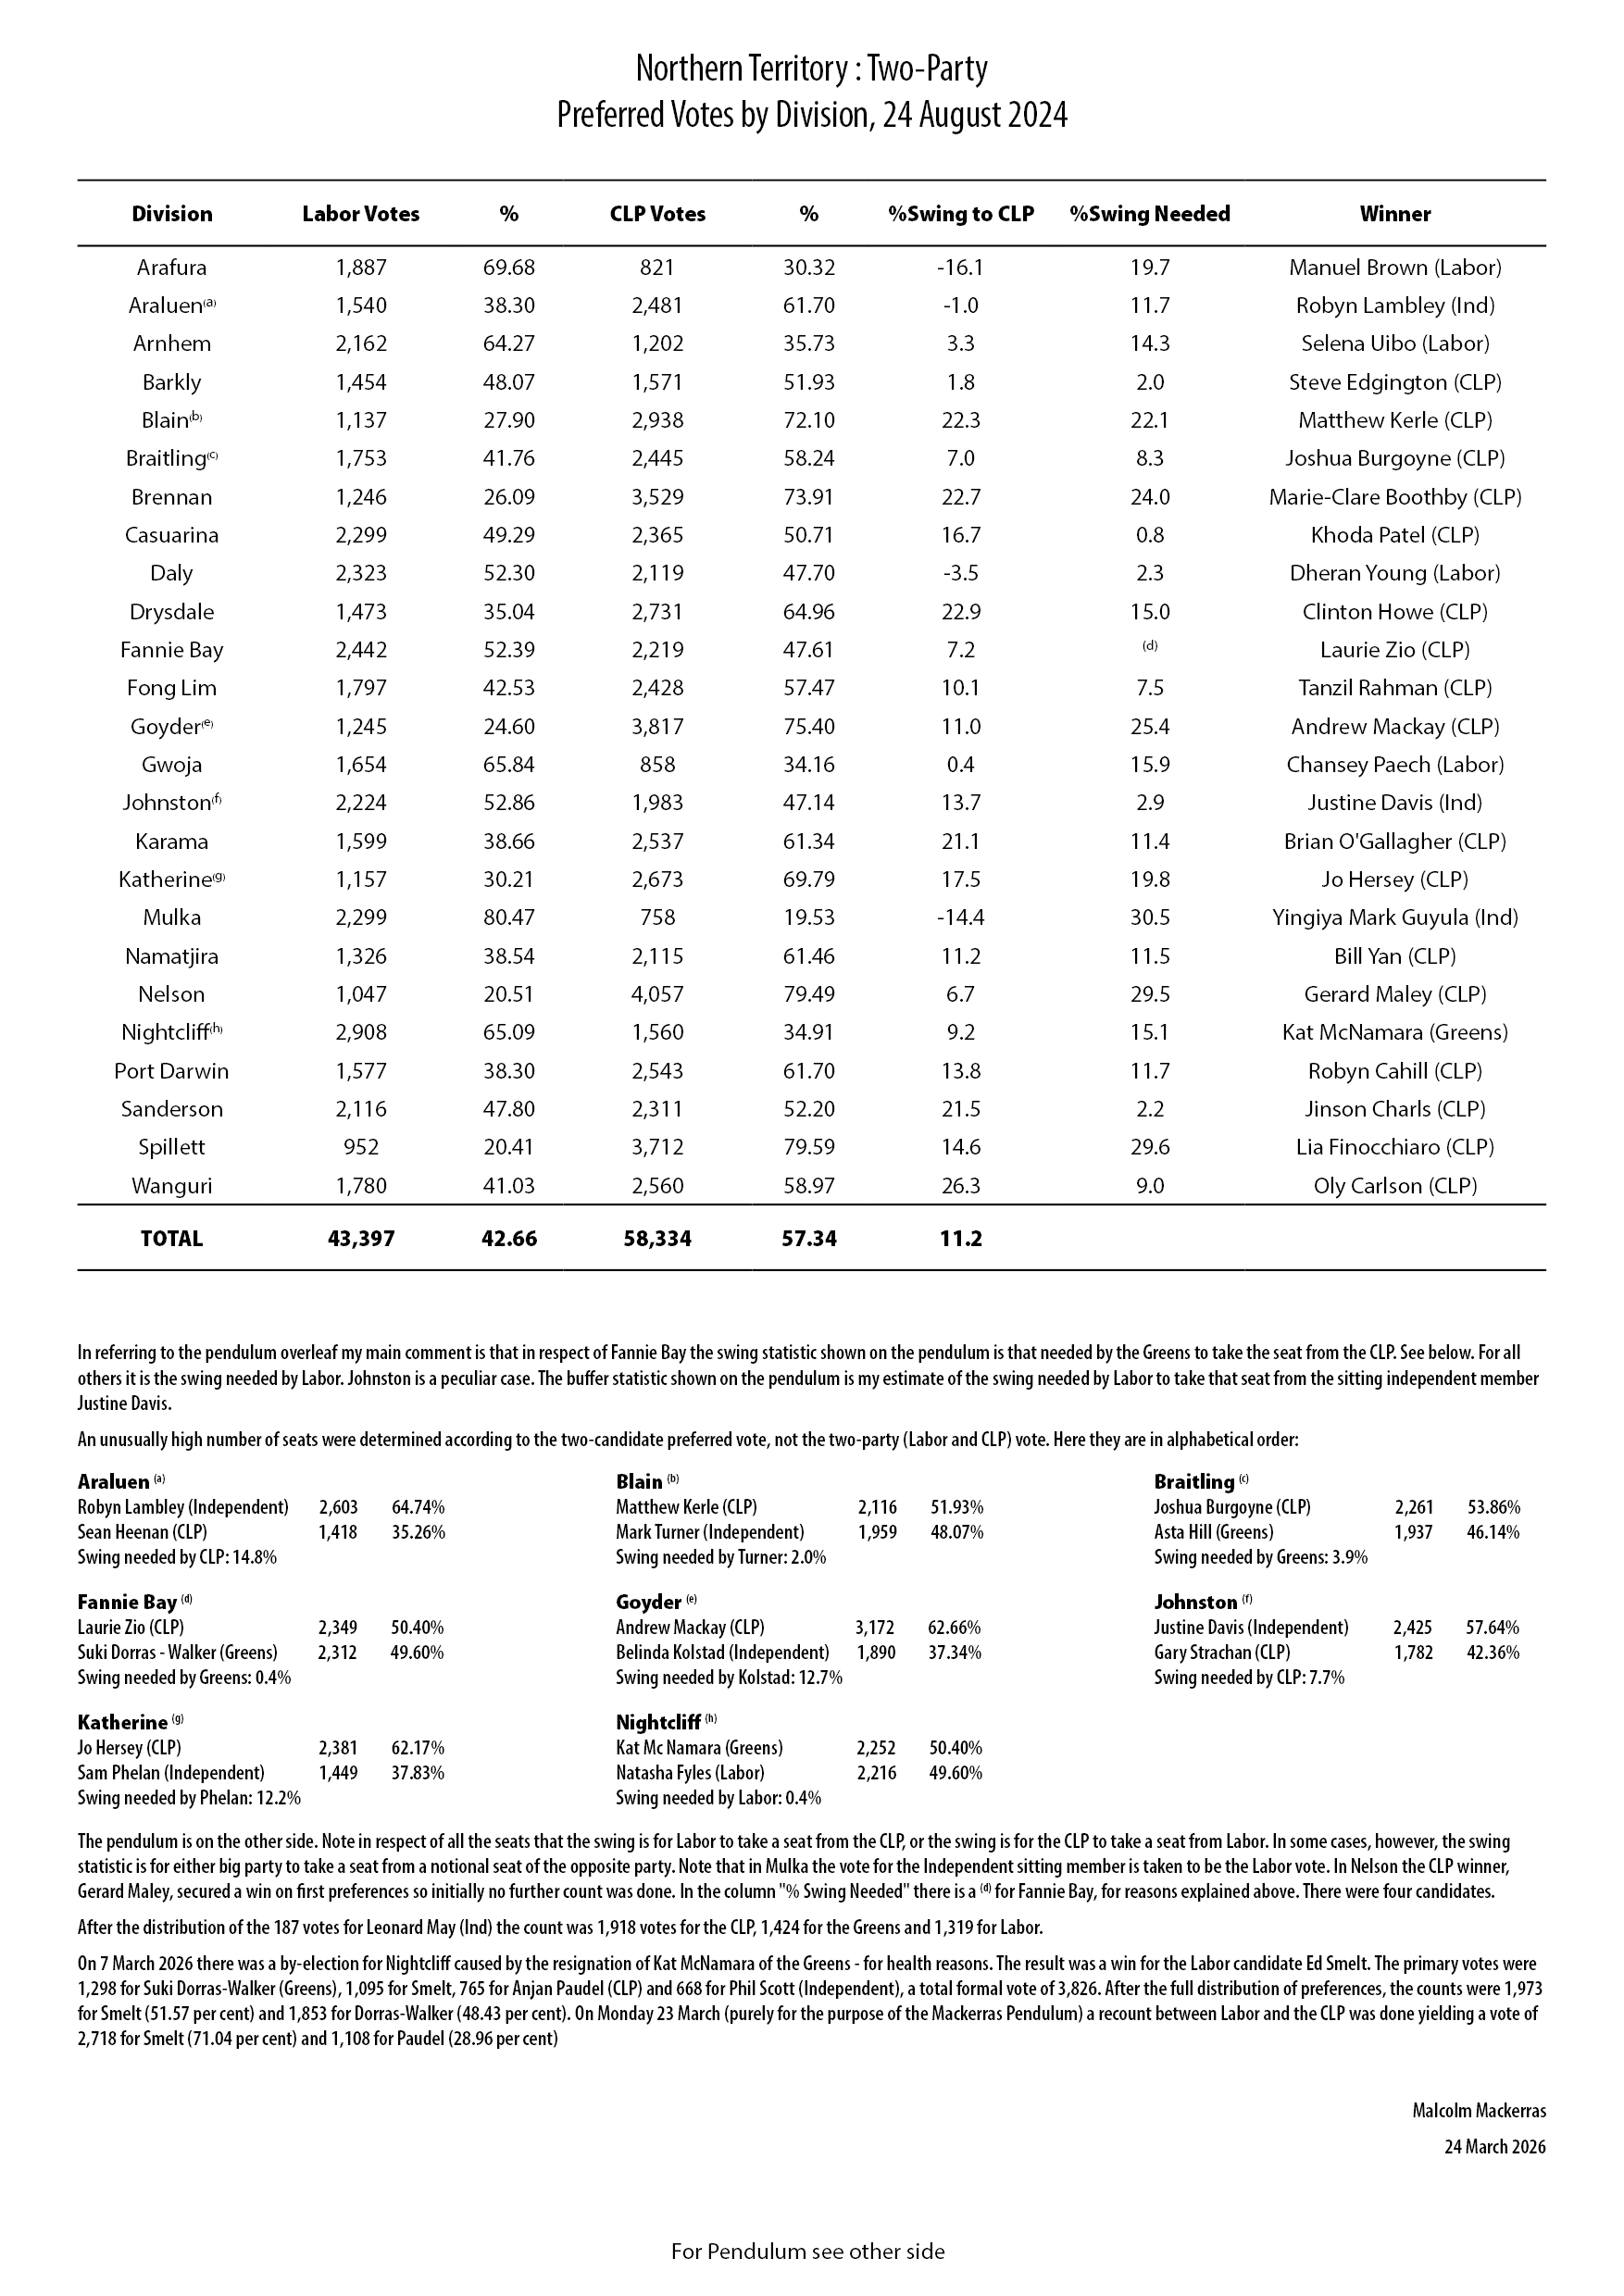
Northern Territory: 2024

Northern Territory: 2020-21

Northern Territory: 2020

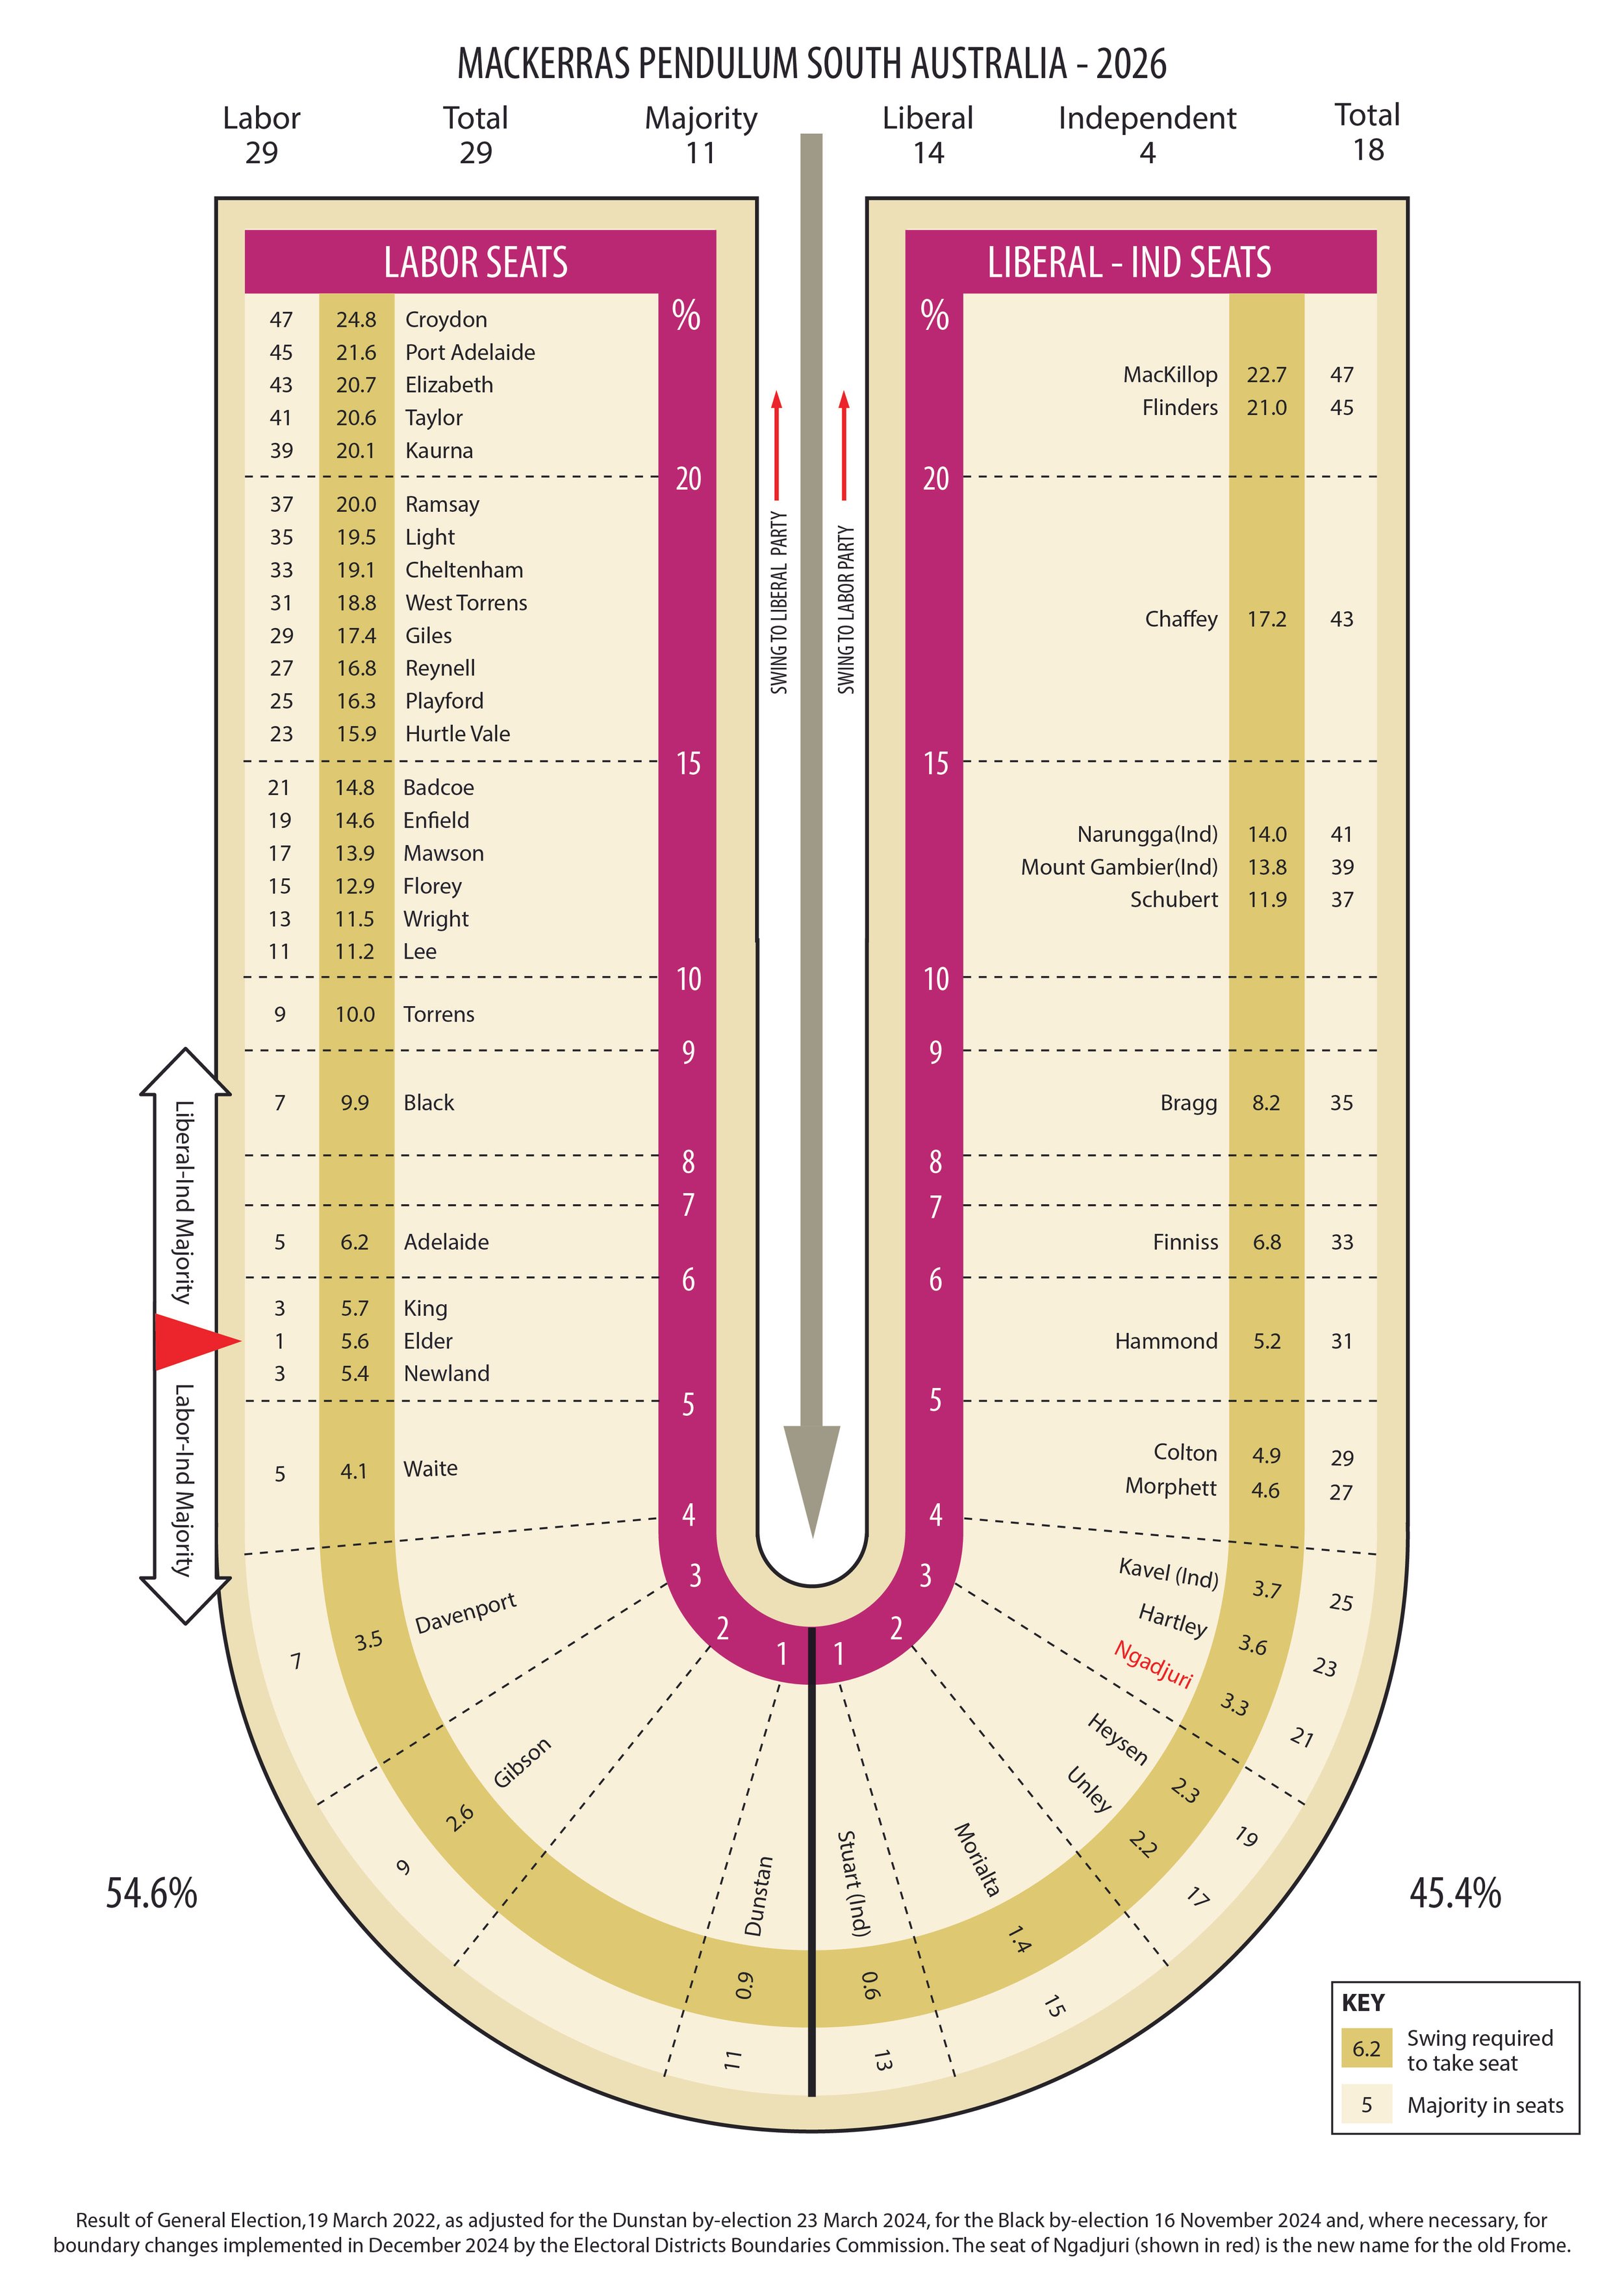
Mackerras Pendulum South Australia: 2026

Mackerras Pendulum South Australia: 2022 Result

South Australia: 2022
The Mackerras Pendulum Works Well
The order of placement of my pendulums has been explained above. What now needs to be explained is my claim for the pendulum and whether it stands up to historical test. My claim is that I have voted in 24 federal general elections from 1961 to 2022 at which I claimed that the deviations on my pendulum would more or less cancel out. At only those of 1961, 1987, 1998 and 2010 did my claim fail. The best idea, however, is not for me to make claims but to let other writers do it for (or against) me.
It just so happens that in May 2021 Bill Browne, Senior Researcher, Democracy and Accountability Program, of the Australia Institute, published a discussion paper Between sense and nonsense: the predictive power of the electoral pendulum. The Australia Institute is a progressive think tank based in Canberra. Browne’s chosen title for his paper was based on an aphorism attributed to Carl Jung: “The pendulum of the mind alternates between sense and nonsense, not between right and wrong.” The opening paragraph of his paper reads this way:
Since its introduction in the early 1970s, the Mackerras pendulum has been used to predict overall election outcomes by looking at what would happen if the overall swing towards one or the other major party were uniform across every seat. The stated expectation for the pendulum is that seats that are predicted to fall that do not fall should be roughly balanced out by seats that are not predicted to fall but do fall. In other words, the pendulum’s prediction is only the net seats gained or lost by the major parties – not which particular seats will fall or not fall. The electoral pendulum has served as a “good guide” (predicting within two of the correct net seat change) in three of the last seven elections.
Browne placed “good guide” in inverted commas as explained in these paragraphs:
The 1990 evaluation of the pendulum by British psephologist David Butler described it as a “good guide” in elections where its prediction was within two of the actual result, and otherwise where its prediction was four or more out. There were no elections where the pendulum was three seats out in the period Butler considered.
In our evaluation of the seven House of Representatives elections 2001-2019, the pendulum has an “error” of 1 in two elections, an error of 2 in one election, an error of 3 in two elections and an error of 5 in two elections, as shown in Figure 1. By Butler’s measure, that makes the pendulum a “good guide” in only three of the last seven elections.
A look at Figure 1 reveals that the errors were 2 seats in 2001, just 1 in 2004, 3 in 2007, 5 in 2010, 5 in 2013, a mere 1 in 2016 and 3 in 2019.
My first comment is that I have studied Browne’s work and agree with his statistics for 2001, 2004, 2007, 2010, 2016 and 2019 but in 2013 I insist that the pendulum made only four errors. That being the case only 2010 saw the pendulum make an excessive number of wrong predictions.
So, the only election when the pendulum fared really badly was that held in August 2010, the election won by Julia Gillard. The loss of Labor seats was five less than would have been the case had the swing been perfectly uniform.
It so happens that over the years I have designed pendulums prospectively or retrospectively, beginning with 1958. In 2012 a group of ANU academics (including me) published a book dealing with the 2010 election and titled Julia 2010: The caretaker election. This is the comment I made on page 320:
The close 1961 and 2010 elections make for an interesting comparative exercise, with party roles reversed. In both cases a Queensland anti-government landslide nearly brought the government down. In both cases, however, Victoria saved the government. In both cases the system of compulsory preferences saved the party in power. In 1961 the 80-20 distribution of DLP preferences in favour of the Coalition saved the Liberal Party the seats of Bennelong (NSW), Bruce (Vic), Maribyrnong (Vic) and Moreton (Qld) where Labor candidates led on the primary vote. In 2010 the 80-20 distribution of the preferences of the Greens in favour of Labor saved them the seats of Banks, Reid and Robertson in New South Wales, Corangamite, Deakin and La Trobe in Victoria, and Lilley and Moreton in Queensland where Liberal candidates led on the primary vote.
The large number of marginal seats in Queensland acts as a warning. If there is a landslide against the government of the day in Queensland that government will lose more seats than would be the case on a perfectly uniform swing. Apart from that, however, my claim stands up. Of the 24 elections in which I have voted the pendulum worked well in 20. Only in 1961,1987, 1998 and 2010 did it fail.
So, the cancellation of deviations is alive and well. Those are the words I wrote before the May 2022 federal election, bearing in mind that the Australia Institute paper by Bill Browne was published just before that election. I have attached that paper hereto but add that another writer, Professor Murray Goot, also wrote articles for The Australian about this. Both the Browne paper and the Goot articles are attached hereto.
My most recent pendulum also worked well. On a uniform swing of 3.7 per cent it showed eight seats changing from Liberal to Labor. In the event ten seats changed from Liberal to Labor. There were swings to Liberal sitting members in Bass and Braddon. The swing to Labor in Longman was below average – so the Libs kept those three highly marginal seats.
However, swings to Labor were above average in the Labor gains of Tangney, Bennelong, Hasluck, Pearce and Robertson – five seats. They were extra good results for Labor more-or-less cancelling out the poor results in Bass, Braddon and Longman.
The cancellation of deviations is, indeed, alive and well!
Malcolm Mackerras AO
3 March 2023